SVG charts
I really enjoy building different types of charts. To me, it feels like the programming equivalent of painting. For this
website, I have built a small collection of utility functions. I use these functions to draw all of the charts on
this website. In this post, I will be sharing the code for some of them, as well as some tips and tricks.
Coordinates
I started with functions for converting my data points into coordinates. Normalizing these values is crucial to ensure
they fit within the boundaries of the target element.
The conversion requires the width and height of the element that is going to be wrapping your chart. I also wanted the
charts to adapt to the screen size. Therefore, I used the resize observer API to extract this information at
runtime.
I didn't want to set the scale of the y-axis to a fixed value either. Personally, I think you can improve the aesthetics
of the chart by not drawing too close to the edges. I wrote a function that would find the largest value in my array,
and multiply it by a padding factor. This value would represent the charts apex.
With variables for the maximum value, width, and height I performed linear transformations to retrieve the
y-coordinates.
const y = (value / maximumValue) * height
However, we must bear in mind that the 0,0 value is at the top left corner. To account for this, I had to take the
height of the chart and subtract the y value:
const adjustedY = height - y
To set the x-coordinates I took the width of the chart, and subtracted a padding. I then divided that value by ones less
than the total number of data points. This gave me the space increment between each data point on the x-axis:
const spaceIncrement = (width - horizontalPadding) / (data.length - 1)
The last thing I had to do in order to get the coordinates was to iterate through the array, multiply the increment with
a particular value's index, and add half of the horizontal padding.
Drawing
Now, with the coordinates in place, you can start to play around with different ways of connecting them.
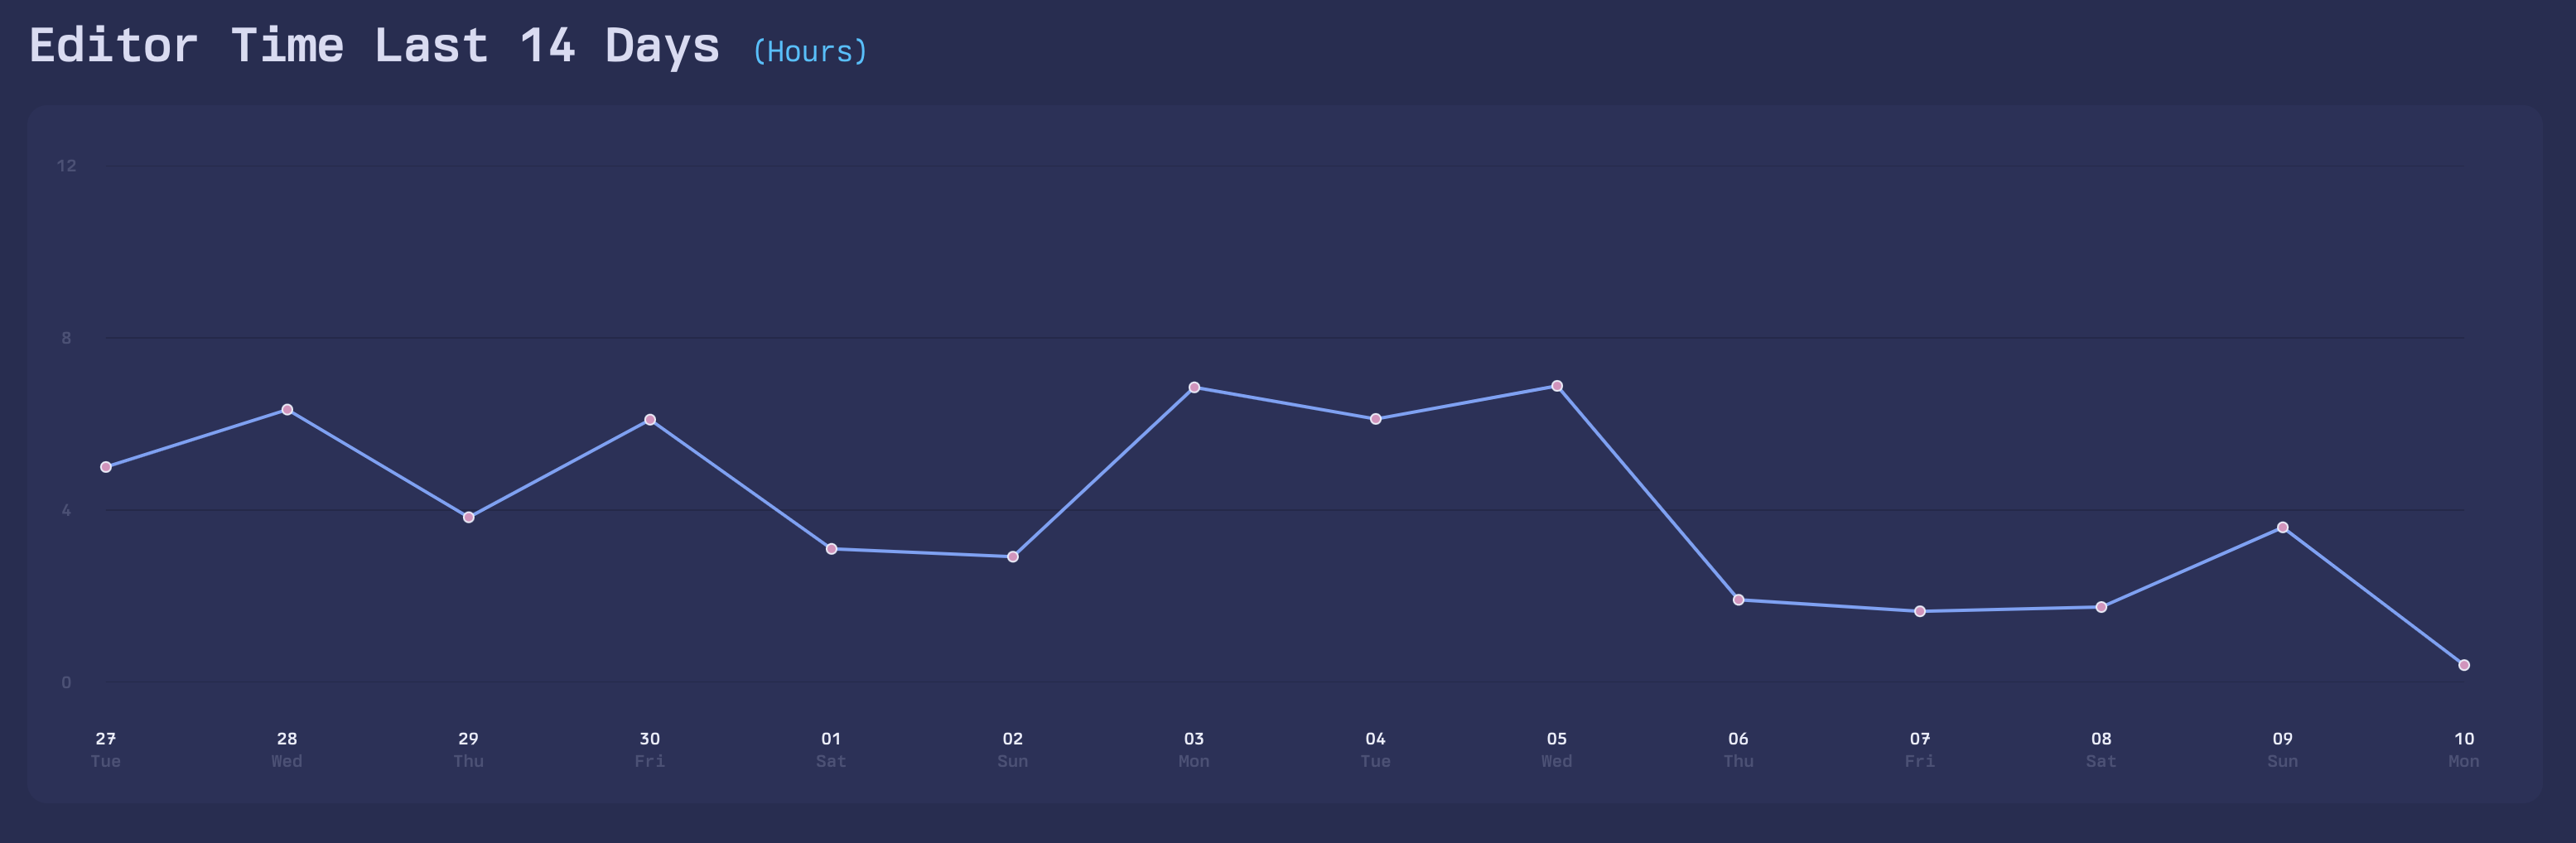
I began by reducing the array of coordinates into a sequence of instructions. To draw a svg path you have to prefix the
initial coordinate with an uppercase M, an abbreviation for move. Then, you are able to draw lines to the remaining
coordinates by using L, which stands for line:
const pathString = coordinates.reduce( (acc, cur, idx) => (idx === 0 ? `M${cur.join(' ')} ` : `${acc} L${cur.join(' ')}`), '',)
Here is a screenshot of the path:
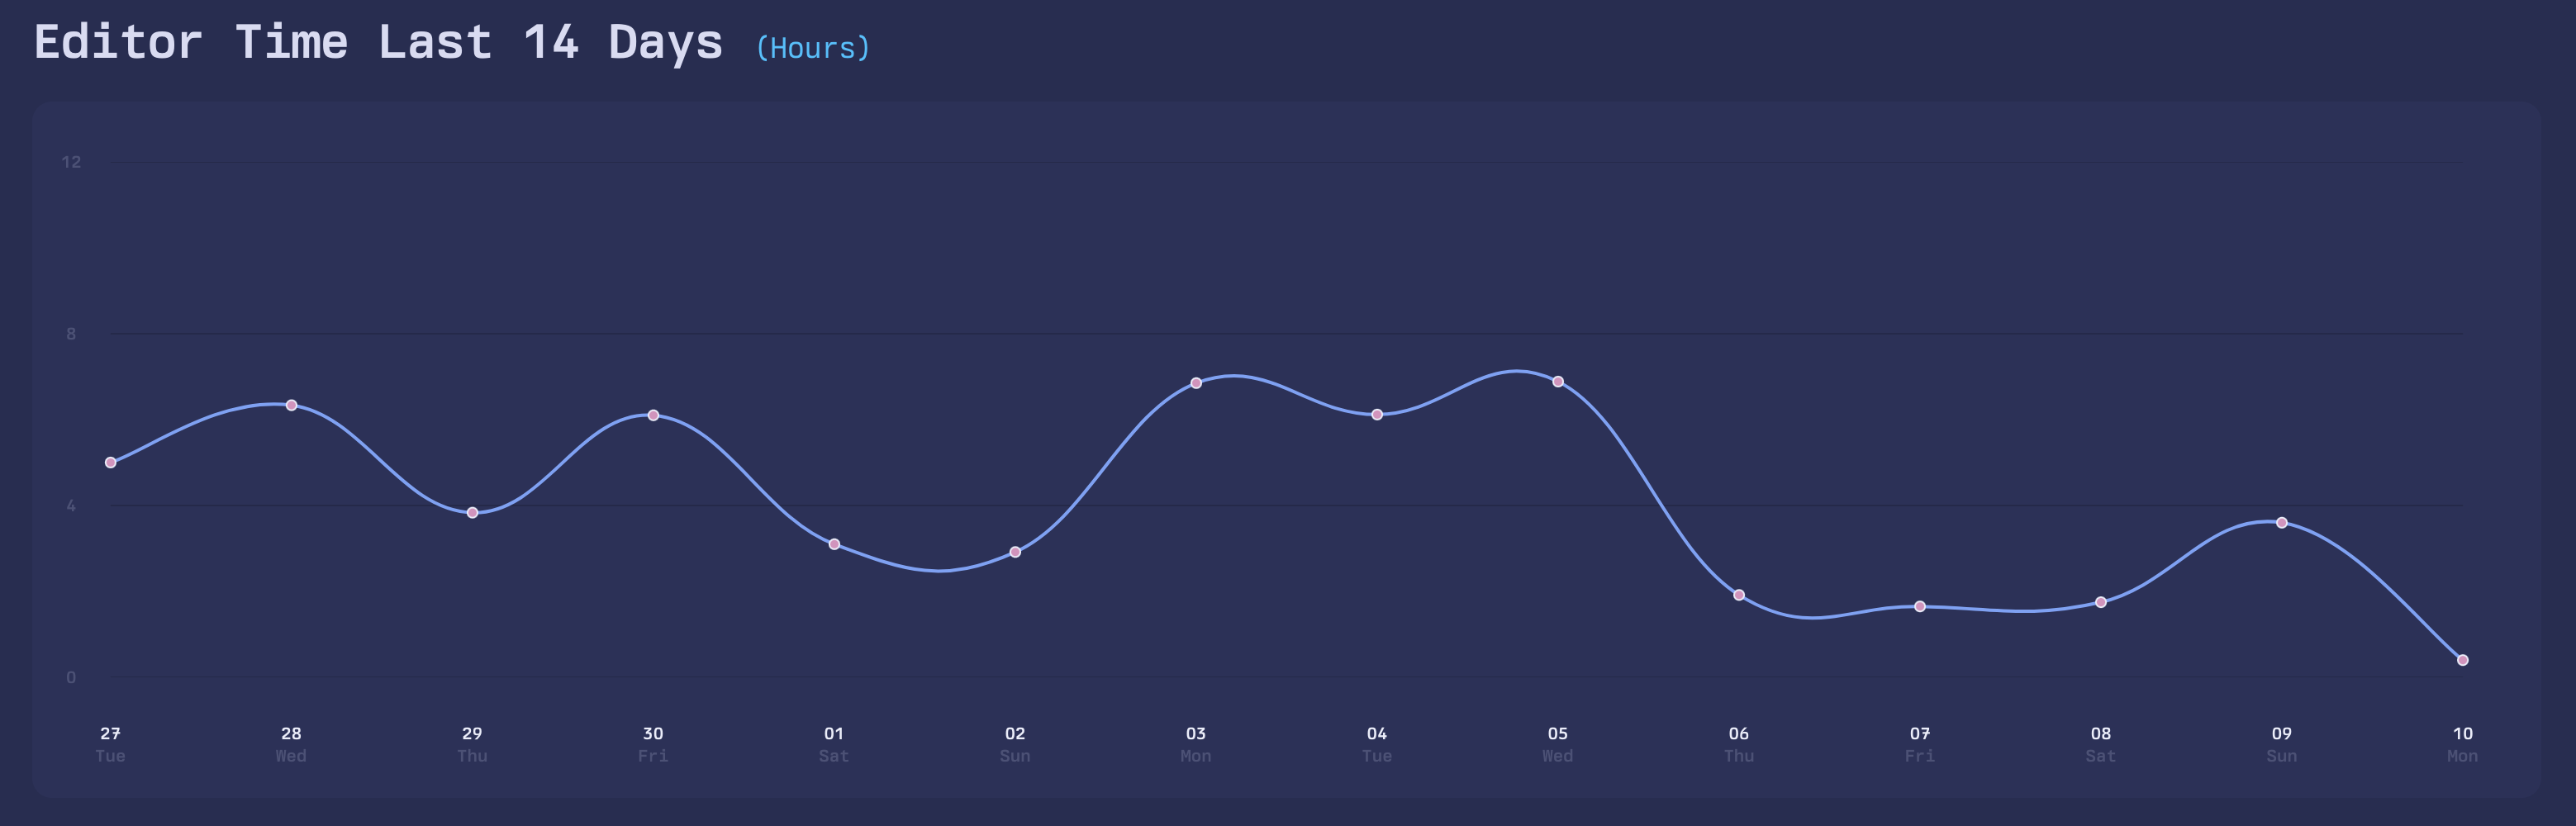
To improve the visual appeal of the chart I wanted to make the lines smoother. Instead of using L, for drawing
straight lines, I used C to draw cubic bezier curves. I still used the same reduce function to create the path, but
with one minor adjustment. I replaced the second branch of the ternary with a function that would inject four additional
coordinates for the control points. The control points are used to smoothen the slope of the curve. I also defined a
variable to determine the degree of line curvature:
const smoothing = 0.2const pathString = coordinates.reduce( (acc, cur, idx) => (idx === 0 ? `M${cur.join(' ')} ` : `${acc} C${bezierCurve(e, i, a, smoothing)}` '',)
function bezierCurve(cur: Array<number>, idx: number, arr: Array<Array<number>>, smoothing: number) { const previousPoint = arr[idx - 2] const nextPoint = arr[idx + 1] const startControlPoint = controlPoint(arr[idx - 1], previousPoint, cur, false, smoothing) const endControlPoint = controlPoint(cur, arr[idx - 1], nextPoint, true, smoothing) return `${startControlPoint[0]},${startControlPoint[1]} ${endControlPoint[0]},${endControlPoint[1]} ${cur[0]},${cur[1]}`}
Calculating the control points requires a little bit of trigonometry:
function controlPoint(cur: Array<number>, prev: Array<number>, next: Array<number>, reverse: boolean, smoothing: number) { // If this is the first or last indexes of the array we will // anchor the control points to the current value instead const pointBefore = prev ?? cur const pointAfter = next ?? cur // Get the length and angle of the line const [lineLength, lineAngle ] = lineLengthAndAngle(pointBefore, pointAfter) // To reverse the line we can use Math.PI (which is equivalent // of 180 degrees) to make it point in the opposite direction const angle = lineAngle + (reverse ? Math.PI : 0) // This calculates the distance from the current point to the // control point. We multiply the distance by a smoothness factor. // This determines how "tight" or "loose" the curve is going to feel const length = lineLength * smoothing // Now, we'll just have to find the coordinates of the control points. We can // use Math.cos and Math.sin to achieve this based on the length and angle const x = cur[0] + Math.cos(angle) * length const y = cur[1] + Math.sin(angle) * length return [x, y]}
function lineLengthAndAngle(pointA: Array<number>, pointB: Array<number>) { // Calculate the horizontal and vertical distance between the two points const deltaX = pointB[0] - pointA[0] const deltaY = pointB[1] - pointA[1] return [ // We can utilize Math.hypot to compute what is known as the Euclidean distance. // It represents the straight-line distance between our deltaX and deltaY Math.hypot(deltaX, deltaY), // The angle is going to be equal to the radians between the two points Math.atan2(deltaY, deltaX),]
}
Here is a screenshot of the same path being drawn with bezier curves:
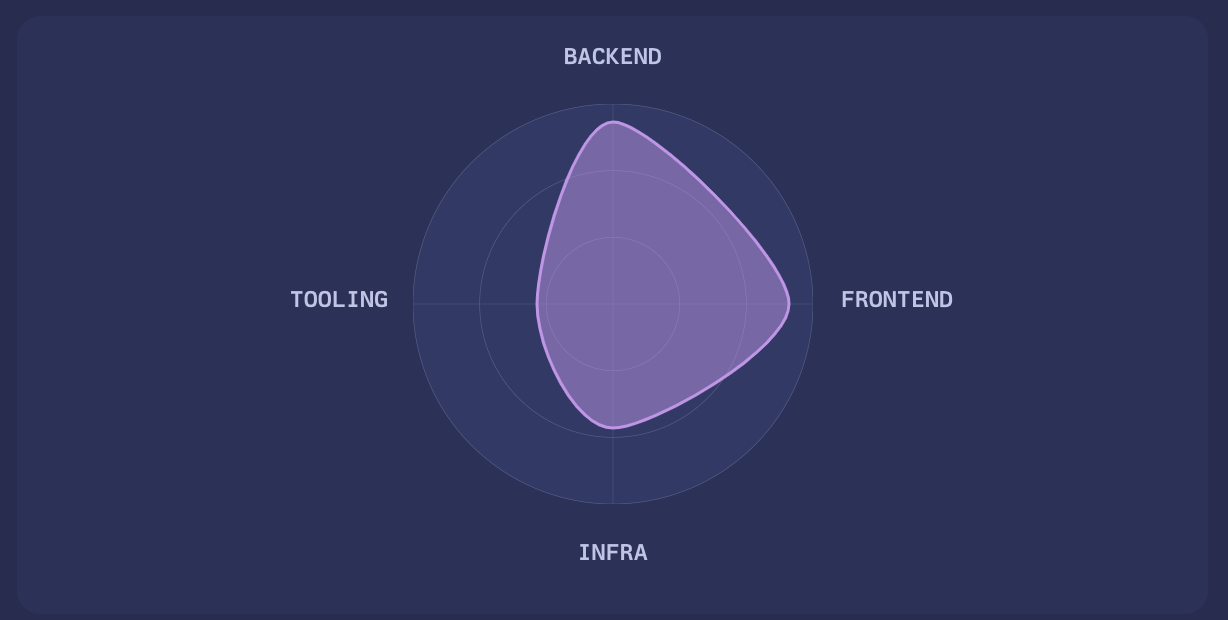
For the mobile version of the line chart, as well as the radar chart, I added a boolean to signal whether or not the
chart should be enclosed. If true, I make sure to connect the last and first coordinate.
For the radar chart this is being done by drawing another cubic bezier curve:
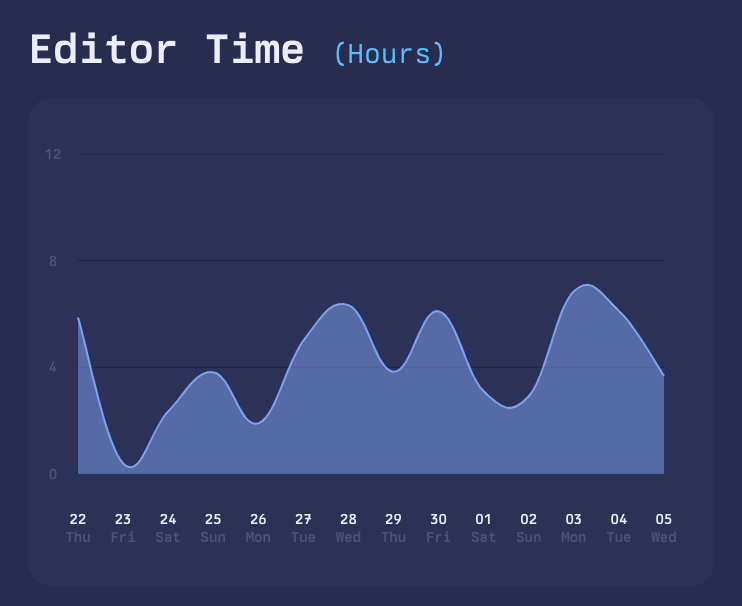
And for the mobile version of the line chart, I used a couple of straight lines instead:
Adding animations
I wanted the charts to feel like they were trying out different shapes before making one last transition to their final
form.
To avoid performance issues I created a function that would calculate enough shapes to accommodate a loading time of 3
seconds. Next, I fed these shapes to another function where I used interpolation to calculate all of the coordinates
that would be required to transition the chart through each form at 60 frames per second.
I also added some randomness to the curvature of the lines. This, in my opinion, made the animations feel more "alive".
Here is a GIF that displays the radar chart animation:
If you want to see the animations for the other charts, you can click on to make the website open in a new tab
(which will replay the animations).
The end
I usually tweet something when I've finished writing a new post. You can find me on Twitter
by clicking